As the owner of an aircraft with a reasonable operating ceiling (20,000ft) but which is not comprehensively de-iced, I nearly always scrap a planned IFR/airways flight unless it is virtually assured that the enroute section can be flown in VMC, and in the context of Eurocontrol routings this invariably means VMC on top.
This leads to a need to determine the cloud tops altitude - or at least whether they are likely to exceed the operating ceiling.
Clouds can form anywhere where the relative humidity is at or near 100%; that is simple enough. If you knew where the RH will be at or near 100%, you would instantly know the cloud bases and the tops. You would also make a lot of money...
For forecasting of cloud tops, the publicly-accessible U.S. GFS weather model has generally been used (the UK Met Office treats its 3D model with commercial secrecy) and in recent years various websites have appeared which provide various graphical interfaces to the raw data, ranging from the traditional tephigram/skew-t presentation at a specific location, to whole-route cross-sections. The oldest one is probably NOAA and a more recent one (which offers cross-sections and claims to do some additional processing on the data) is Meteoblue. I have some notes on this subject here. There appear to be several ways to get the cloud vertical extent data out of the GFS model.
Unfortunately, forecasting of the 3D profile of humidity is notoriously unreliable, especially in frontal (convective) weather. Having played around with this for several years, I now think that it offers very little beyond a simple look at the MSLP chart and avoiding the fronts...
The key is that one rarely makes the final go/no-go decision until the morning of the flight. This is because the official forecasts are statistical in nature and to minimise liability the forecasters throw in everything including the kitchen sink. Nothing beats seeing the actual conditions shortly before the flight. An exception to this is when somebody must (e.g.) be back at work on a specific day and the weather risk cannot be tolerated; such flights have to be cancelled some days ahead.
So, what we need is actual cloud tops data - some kind of a "cloud tops METAR"...
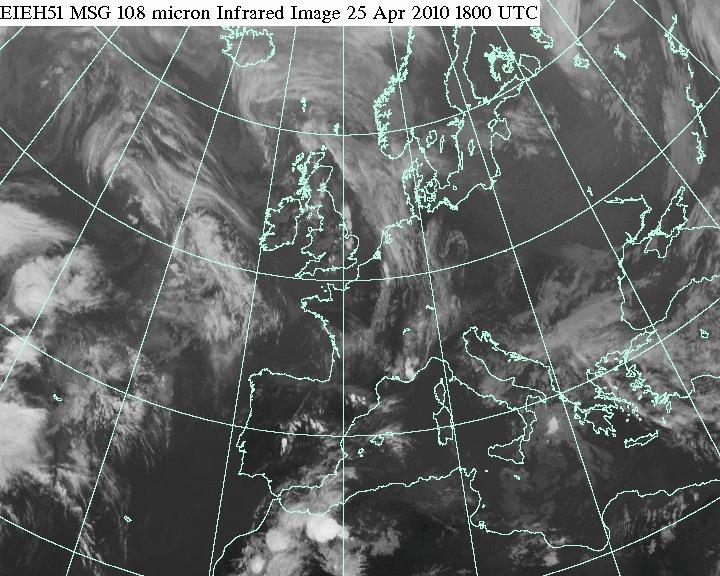
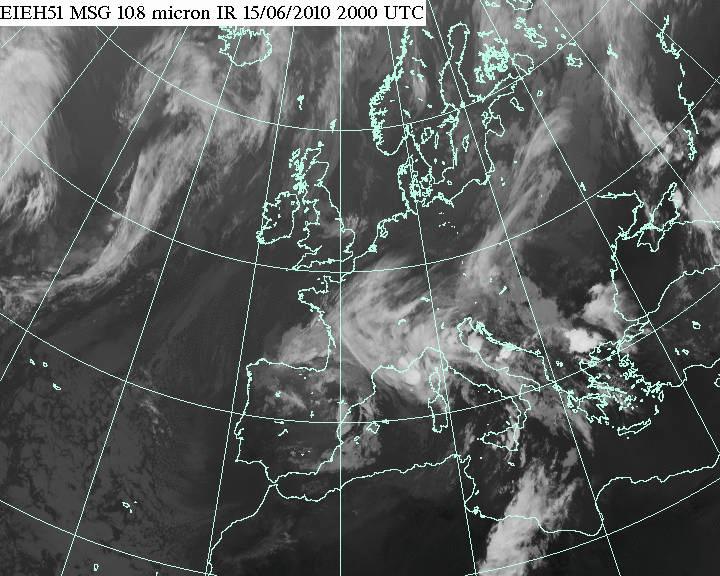
In the absence of US-style PIREPs, there is just one source: satellite imagery showing cloud tops temperatures. This has been around for a while. Most coverage of Europe comes from the EUMETSAT organisation. Some of the data has been made available to the public in a usable form, via the EUMETSAT website and via some European weather websites. I use the UK Met Office site, mainly because it shows data which is reasonably current:
This shows an infra-red image of most of Europe, updated every hour. It is a monochrome image, with a lighter colour indicating a lower temperature and thus a higher altitude. No temperature scale is provided so one has to guess from experience, but in the GA IFR context it isn't that critical.
Update 11/2011: This site (ownership unknown) is providing an IR image essentially identical to the above, also from EUMETSAT, but updated every 15 minutes. Things are slowly improving!
There are other websites which present the data with a temperature scale but all those I have so far found carry data with an excessive delay or with poor resolution - probably to comply with the commercial terms and conditions of the satellite data provider. Like share prices, real time data is sold off at premium prices. This Spanish site shows cloud tops with an altitude scale (in metres!!) which suggests that they combine the cloud tops temperature with the forecast profile of the temperature lapse rate; this is great but ... the data is delayed for up to several hours. The site is also often down. This Turkish site is also good, with a calibrated temperature scale, but it gets updated every 3 hours only. This EUMETSAT site shows just the right thing but with a useless resolution and is hard to use anyway due to not having a land-boundaries grid.
It is always interesting to overlay these satellite images with the MSLP (mean sea level pressure) chart
Even though the map views differ, the correspondence is obvious on the frontal areas. This should not be so suprising, given that the forecasters who hand-draw the fronts tend to use the satellite images as the reference!
In this example, one can also see patches of high cloud (presumably strong convective activity) associated with the trough depicted for central Spain, with a much bigger version over northern Morroco. The strong white colour represents cloud tops of at least FL300 and this provides a coarse "calibration" of the IR image.
Now, on the IR image, imagine a flight from Bournemouth to Toulouse (track about 170). Just past halfway, there is some cloud. The cloud tops are likely to be around FL150. For me, this would be a GO. However, on a flight from Norwich to the east (track 090) the tops are obviously higher. How much higher is a good question but, given the correspondence with the cold front, they are probably above FL200. I would consider scrapping that flight.In many areas, the conditions are very clear. In northern France, and in most of Spain, any cloud will have tops below FL100.
The IR-image method is only approximate - not least because we have no temperature scale. I wrote to the UK Met Office regarding this and their reply was, basically, that they might consider it but not free of charge. One might also worry that there will be a big difference between summer and winter temperatures, but higher altitude temperatures are much less variable than surface temperatures.
One could make the observation that if one cancels a flight on the basis of a front depicted on the MSLP chart - a very conservative strategy - there is little need to look at the IR image, and that is probably true. Most non-turbocharged airplanes cannot outclimb most frontal weather and if the pilot is averse to penetrating the front in IMC (structural icing and turbulence) then he has to cancel. The greatest value of the IR imagery is in indicating the cloud tops where there are no fronts.
What to watch out for
One downside of this use of the IR images is that thin - almost transparent - high altitude cloud will show up as very high cloud tops, but in reality one would either happily fly underneath it, or accept flight within it on the grounds that there won't be icing because the temperatures are too low and there won't be significant turbulence. Fortunately, such cloud tends to show up as patchy on the IR image.
There are also other data sources which can be used to examine the scenario where the IR image shows "excessively" high cloud tops. One is weather radar; the most popular site is Meteox from which the corresponding image is below
This corresponds well with the front to the east of southern UK which is shows on the MSLP chart, and the scattered-TS returns over the southern UK is what one might expect from the troughs depicted on the chart. What one cannot tell is the vertical extent of the returns, but I would definitely regard that front as a no-go. The route to Toulouse looks clean. Free weather radar data is quite a new thing, and new websites are gradually appearing to fill in the gaps (Meteox has no coverage south of the Alps, for example).
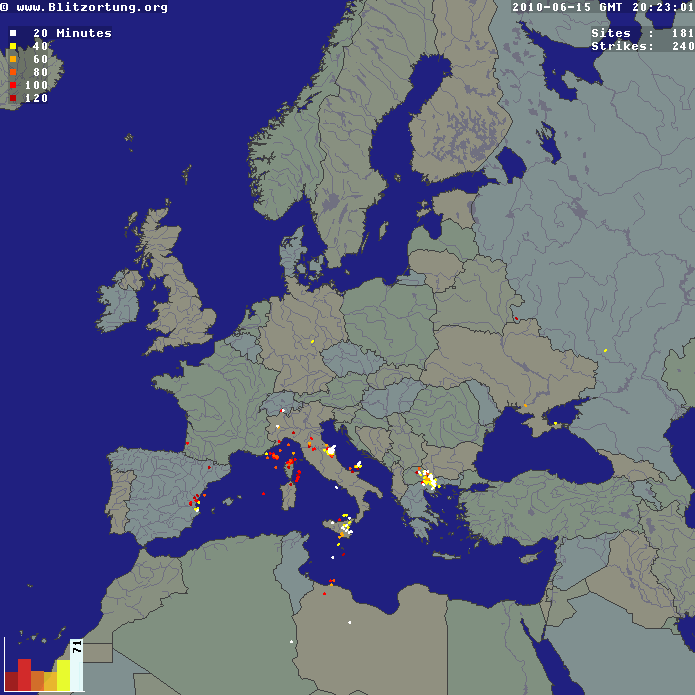
Another source is sferics. This receives the emissions from lightning discharges and is equivalent to the stormscope which many pilots have in their aircraft. However, the ground based systems are more accurate because while an airborne receiver tries to estimate the range from the intensity and spectral dispersion of the return, a network of ground based receivers works out the discharge location by triangulation. There are many sferics sites but my favourite one is here. I could not get a time-corresponding sferics image for this article and here is an example from some time later
which shows a proper thunderstorm south of Sweden. Most of Europe looks totally clean.
I tend to use radar and sferics to rule-out, rather than to rule-in, a flight. In my experience, a solid line on radar like the one to the east of the UK is a solid wall of convective cloud; probably to FL250. The sferics image merely shows areas where one definitely doesn't want to be flying!
How do I get up and down through the cloud?
Next, one has to deal with how to climb or descend through freezing cloud layers. That is more of a personal choice.
The most important thing is to always have an escape route. In this context it means having a freezing (0C) level which is significantly above the MSA. Thus, if excessive ice is picked up on the way up, one can descend and melt it off before landing (and the flight is aborted). However, if this was applied rigidly it would totally prevent IFR flight during much of the winter, and fortunately there are common scenarios where this is not such an issue:
The departure weather is usually self-evident by looking out of the window. If one can see holes with blue sky visible, the cloud is rarely more than a few thousand feet thick. With an overcast sky, and in the absence of frontal activity, if the sky shows a lot of variation in brightness, then the same would apply. Occasionally, with stable high pressure conditions, one gets a very uniform-colour sky, but this merely means the layer is very uniform in thickness; it is rarely thicker than a few thousand feet, and in any case such a stable situation makes it useful to examine the most recent sounding (0000Z or 1200Z - see Univ of Wyoming etc notes here). Climbing up through this kind of cloud is very unlikely to result in significant icing.
If departing from a Class G airport, a good trick - controlled airspace permitting - is to climb up through any holes, or at least head in the most favourable direction, before calling up the IFR control frequency.
The arrival weather is generally less critical because one is descending anyway, and similar considerations apply to the departure scenarios above.
Thunderstorms
If a TS is present in the terminal area, that is a serious safety issue if one is going to be transiting through any IMC, and is likely to delay the departure, or will result in an extended hold when arriving. Fortunately they are easy enough to spot; they look like "tumours" on the IR image:
You can see one west of Corsica, two in the Adriatic (between Italy and Croatia) and one over Macedonia (north of Thessaloniki). The corresponding sferics image corresponds well
Close-up:
The strongly white colour of the TS tops corresponds with them being at FL300 or higher, as one would expect.
I have found this IR-image technique unfailingly wonderful for making preflight decisions for IFR flight in the TB20, whose ceiling is FL180-200. If one's ceiling was say only FL120, it would be much less useful for establishing cloud tops - due to the limited vertical resolution.
Last edited 4th July 2012.
Any feedback, reports of dead links, corrections or suggestions much appreciated
Contact details