Why do they matter? The perception of "instrument flight" among many
VFR pilots is that the whole point of getting an instrument qualification is
that one can fly in the clouds.
IFR Strategy
Nothing could be further from the truth. That's just what you spend weeks doing in your instrument training. In reality, prolonged flight in IMC is avoided at any reasonable cost. At best, there is no outside view which makes it boring - many prospective passengers are sufficiently scared of flying in light aircraft and one needs all the compensation one can get one's hands on. In all but the most benign cloud there is some turbulence and this can reach severe or even dangerous levels if one flies into something nasty which, in the absence of radar, is quite possible during a long flight in IMC. Then there is icing: if the outside temperature (corrected for the aerodynamic temperature rise) is below 0C then supercooled water droplets are likely to exist. In reality icing is very much a hit and miss affair with nothing happening a lot of the time, but one is virtually certain to pick up a lot of ice if one sits in such conditions for some hours, and it can happen very much faster than that in convective weather. Finally... it's cold in cloud! In sunlight, most light aeroplanes pick up a huge amount of solar heat which can avoid the need for any heating even in sub-zero temperatures - just as well since a lot of them have barely adequate heaters.
The whole "IFR strategy" therefore becomes one where you depart, climb as fast as possible through any cloud to reach VMC, stay in VMC for the entire enroute section, and then descend in one more or less continuous descent all the way down to landing.
If your aeroplane is fully de-iced (rubber boots, TKS, electrically heated propellers or some combination of these) then in theory you can fly the whole route in icing conditions - but why? Flying should be enjoyable.
In Europe, cloud tops can be anywhere from below 1000ft to FL450. However, anything above FL200 is likely to be seriously convective and then all bets are off as far as height goes. Fortunately, the top of "organised IMC" rarely exceeds FL160 and this is what enables long distance IFR flight, at Eurocontrol levels, in non-deiced unpressurised aeroplanes with oxygen. You just need an aircraft operating ceiling of FL180 and benign conditions at the two ends of the flight through which to climb and descend. Flying VMC on top, the horizontal visibility is usually unlimited and anything nasty (CBs) can be avoided visually.
This strategy fits in perfectly with the Eurocontrol IFR route system. The MEAs on many routes will place you squarely into freezing IMC much of the year, but ATC always allow a climb request "due weather".
Some pilots say that nobody should fly IFR in anything less than a de-iced twin / King Air / jet but this is nonsense. The capability for prolonged flight in icing conditions merely reduces the percentage of preplanned flights that are cancelled on the day. De-icing gives you the ability to climb and descend through thick layers of freezing cloud (e.g. solid IMC all the way to FL180) and the ability to accept an ATC holding instruction placing you into prolonged icing conditions. However, holds are extremely rare in GA IFR flight and de-iced aeroplanes tend to also be radar equipped which facilitates close-in tactical CB avoidance. It would be a very different matter if one was flying a Cessna 150 which cannot even climb to the MEA on many IFR routes...
It's worth mentioning at this point that UK pilots flying under the IMC Rating are often unable to fly VMC on top because much of the UK is covered with Class A airspace whose base is below the typical cloud tops. For flights within the UK, this is really the key advantage of the full IR over the IMC-R and is particularly relevant in the winter when the full IR enables the enroute section to be flown out of icing conditions.
Where do clouds form?
Everybody knows that clouds form where the humidity reaches 100%. The rest needs some understanding of meteorology which I will largely skip over - partly because it isn't my area of expertise and partly because I set out to produce an easy to digest collection of practical advice for pilots. The theory is anyway of little use without a website on which one can push buttons and actually get the data.
The cloud bases are to some degree predictable from the convergence of the reported surface temperature and dew point and there is even a formula which has been known to occasionally work: temperature-DP spread multiplied by 400ft, so if the surface temperature is +10C and the DP is +4C you might expect the bases to be around 2400ft. This works with some cloud types better than others.
Cloud base forecasts are widely available in TAFs and other aviation data. These tend to be reasonably accurate because they are normally produced by full-time weather professionals who have access to a wide range of ground observations. They are also easy for the pilot to verify at the time by looking at the relevant METARs, or simply looking upwards into the sky.
The cloud tops are much more difficult. Obviously this boundary will again occur where the humidity falls below 100% but the conditions where this happens depend on many factors such as the convective energy within the cloud. There is also much less data available to the meteorologist: instrumented baloons ("ascents") are launched at 0000Z and 1200Z and these return accurate data but only for a few locations in each country. The mainland USA has a comprehensive system which takes in weather radar data, satellite data, and pilot reports (PIREPS) but Europe either has nothing of the sort or the Met offices keep it very close.
Weather Models
There are several weather models around the world but probably the most relevant to UK and European pilots are the UK Met Office (UKMO) and the U.S.-run Global Forecasting System (GFS).
All UK pilots will know about the free chart products from the UKMO: 215 (UK) and 415 (near Europe). These charts are produced about 12hrs ahead. The Mean Sea Level Pressure (MSLP) charts run several days ahead and they are the only free product from the UKMO which goes past 24hrs with any relevant detail.
The UKMO runs a commercial policy on everything beyond the above data. I have used numerous commercial forecasters (those on premium rate telephone numbers, to check my own assessment of difficult weather conditions for a go/no-go decision) and it's obvious they have access to data which goes way beyond anything openly available.
This leads to GFS. This weather model is totally free. The output from it is numeric and needs to be plotted into something graphical. One of the many websites that do this is NOAA which generates nice clear graphical data 0-84hrs, 0-180hrs, or 192-384hrs (the last one is obviously largely fiction). In fact nearly all of the free aviation weather websites use GFS data.
The SigWx form is what most commercial pilots use for an instant general briefing. This goes from FL100 upwards and is generated about 12 hours ahead. The data for it comes from the World Area Forecast Center (WAFC) in London. In October 2007 the SigWx form was modified to no longer show fronts and cloud type - a curious move probably driven by the jet (upper airway) customer base.
Where is the Cloud Tops data?
The UKMO forms 215 and 415 and the SigWx give cloud tops as straight numbers. The 215/415 go up to FL100 only and show near-Europe only. The SigWx shows weather above FL100 and is thus the first choice for enroute conditions. However these forms are generated only up to about 12 hours ahead.
If a pilot wants data further ahead than the SigWx, or wishes to cross-check the SigWx against something else, this gets more complicated, and leads us to thermodynamic diagrams.
The "gold standard" for working out where there is IMC, and lots of other stuff like temperatures, is the Tephigram; whose very similar counterpart is the Skew-T is shown below; this particular sample is real data generated by a baloon ascent:
This most useful chart plots the dew point and temperature (the left and right lines on the above, respectively) against altitude in millibars. Where the two get close or meet, you can expect IMC, roughly according to the following rules:
<1C means 7-8 octas cloud
1-2C means 6-7 octas cloud
2-3C means 4-5 octas cloud
3-5C means 2-4 octas cloud
>5C means clear
On the above example, it is immediately obvious where the two lines meet and one would expect the cloud bases around 3,000ft and the tops gradually dispersing around 8,000-9,000ft, and blue skies above that. The 0C level is around 10,000ft (the blue 0C line intercepts the temperature line at 700mb) which is perfect for a climb up through the cloud without a risk of icing.
The baloon ascent data can be found at the University of Wyoming website - select Region=Europe and Type of Plot= GIF/Skew-T. It's bizzare that one has to go to a U.S. university website to get ascent data from UKMO probes but much of the aviation weather scene is like that - an organisation releases some data only to its commercial customers but at the same time has international obligations to release it to other parties who in turn very usefully put it on a website... If would be funny if it wasn't so important. Update: it can also be found at the Univ of Cologne.
A forecaster can work out all kinds of other things from these charts e.g. stability - the likelihood of significant vertical development like CBs. A google on "tephigram" or "skew-t" comes up with an unlimited amount of reading material on the interpretation; for example here (local copy). In fact the atmosphere has very few secrets left - at that spot and at that time - after the baloon probe has gone up through it. Forecasters generate all the well known data like TAFs and the 215/415 forms from tephigrams generated by the ascents and the computer models.
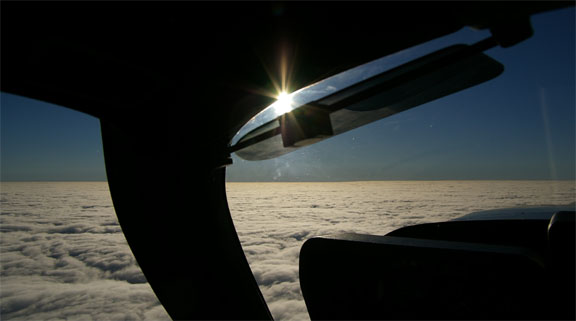
Unfortunately data for 0000Z or 1200Z (appearing on the website an hour or two later) is of limited use for most long flights which tend to depart in the morning. The exception is widespread stable high pressure air masses; the following ascent corresponds to the photograph at the top of this article and was spot on despite being 10 hours old at the time of the flight:
The $64M question: can we get forecast tephigrams for an arbitrary time in the future? Yes - any computer model can be used to generate a tephigram, or of course any other type of chart. Unfortunately the UKMO offers this "3D" data to commercial users only. This is a shame, since the UKMO weather model is probably the most accurate for the UK and nearby areas. One known free source of forecast tephigrams is the Swiss Meteoblue website whose development was reportedly the PhD project of University of Basle student: and the following random example is from it:
This is a Tephigram which is plotted slightly differently to a Skew-T but the basic idea is the same. This one shows mostly IMC up to about 800mb (roughly 6,000ft) and clear skies above. The 0C level is at 700mb - excellent flying conditions and climbing up through the 2000-3000ft of cloud should not present icing hazards.
The Meteoblue site appears to be based on GFS and a mixture of other data and enables all kinds of charts to be generated, including the vertical conditions along a straight line flight as in the example below. Unfortunately the site uses client-side Java and in common with many such websites runs with varying degrees of reliability according to your operating system and other factors. Often, one gets a blank page and has to press F5 (refresh) to get it to work. It has plenty of quirks; for example to obtain the "Cross Section" chart shown below, one has to choose Condensate for the first plot option and Temperature for the second; reversing the two crashes it.
Another site that delivers forecast tephigrams is the previously mentioned NOAA site, under "Soundings". This came to my attention some time after this article was written...
Comparison
Let's do a comparison of the three data sources we now have: Meteoblue, SigWx and the actual ascent. The following Meteoblue forecast was done 30hrs ahead for a 1200Z flight from Shoreham (EGKA) to Ljubljana (LJLJ) across the Alps:
The above chart shows cloud to around 550mb (16,000 feet) at three points along the route - feasible for an unpressurised aircraft with oxygen and a 20,000ft ceiling. The 0C isotherm is also visible and I have placed yellow dots on it to make it more obvious. The red bits are obviously below freezing and one would not fly in them; flying below would be a problem with terrain clearance so the only way is straight above the whole lot. Crucially there is little or no cloud around the departure and arrival which is exactly what you want for the climb and the descent.
The corresponding 1200Z SigWx (flight superimposed in yellow):
The SigWx shows a rather different picture to Meteoblue. Area 16 shows tops to FL160; Meteoblue shows nothing. Area 14 shows tops to FL200 (Meteoblue isn't far off there) and tells us these may be CBs. Finally, Area 10 shows tops to FL130; Meteoblue shows nothing there but this is more of a timing issue because the whole weather system is moving to the SE. Clearly, the big suprise is Area 16 which appears to require a climb through a thick freezing layer. Are we being unfair to Meteox because that was a 30 hour forecast whereas the SigWx is much closer? In fact the Meteox chart done a few hours before the flight looks essentially the same as the previous one... Unfortunately, while the SigWx form looks attractive for this job, it does not forecast vertical cloud extent; the vertical extents of the scalloped areas apply to the icing or turbulence only !!
On the basis of the foregoing, and putting this together with the MSLP chart showing the occluded fronts all over the place, I would have probably scrapped the flight.
Please note this analysis does not take into account the flight time of around
5 hours; the picture in active weather like this would be expected to change
significantly during the flight.
The actual data from the 1200Z baloon ascent is below; this was done at two points corresponding to the highest-tops found within Area 16 and Area 14:
The ascent for Area 16 shows some kind of a top around 6,000ft but in fact the
cloud in the area varied widely and a lot of it was merely scattered to broken
in a thin layer.
The ascent for Area 14 shows a lot of cloud to about 17,000ft. The SigWx is therefore slightly pessimistic and Meteoblue was closer to the mark.
Other Methods
There are various other websites that process GFS data into something from which cloud tops can be inferred. This well known U.S. Air Force site offers various graphical products including an Icing chart (under Flight Hazards). The following example again corresponds to the above flight and was generated 30 hours beforehand
and indicates light icing from FL030 to FL140 which - give or take a few thousand feet - is a good confirmation of the data from Meteoblue but it shows no evidence of Area 16 in the SigWx.
Another useful tool for the IFR pilot is weather radar. In the past this was available only as a premium chargeable service and that was just for the UK. In fact the data is still tightly marketed by a consortium of European weather offices, but various websites now carry enough of it to provide a useful picture for Europe. The most interesting one is Meteox which combines several radar data feeds and delivers it through an advertising-funded website with a delay of 30-45 minutes.
Meteox radar does not tell us the height of the tops but experience suggests that anything showing RED on Meteox is a definite no-go and contains convective cloud to at least FL250. Weather showing as heavy white bands has been regularly observed to be at FL200 when flying to one side of it. It would be easy enough to use the baloon ascent websites to get snapshots of weather depicted on weather radar and do comparisons. The following radar image corresponds to the 1200Z flight discussed above
Meteox has a nasty catch: the coverage stops suddenly at non-participating country boundaries, or radar head distances, and these boundaries are not indicated on the image. In this case we have no coverage of Italy or Austria; separate websites need to be consulted for these. Some Italian radar data can be seen here and I have a collection of radar websites here.
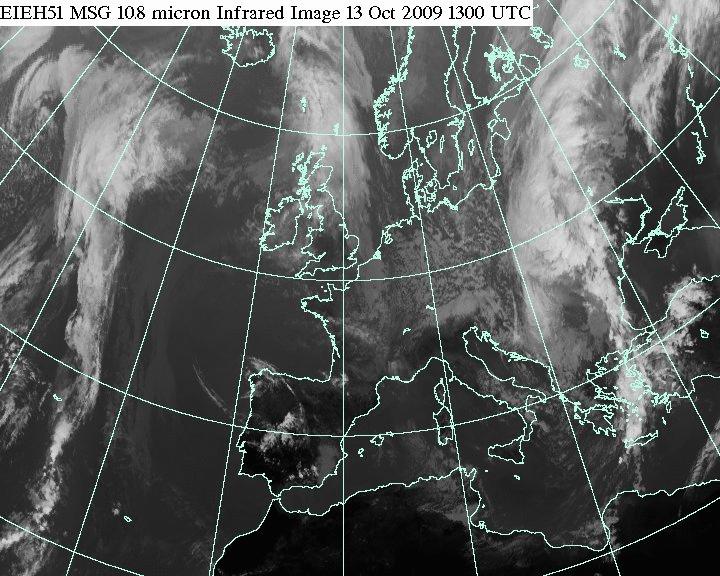
Finally, there are websites that show satellite images with cloud top temperatures. If one has a good idea of the temperature/altitude profile, this should yield the approximate cloud top height. An IR image can give temperatures directly, and the following example again covers the same flight:
The satellite image shows high level cloud over N France (the SigWx Area 16) with tops around -20C which (referring to the well known Form 214/414) would be around 14,000ft but this is so widely scattered it would not be an issue. It also shows very high cloud tops (green, around -40C) in Area 14 but again this is localised and one would have flown a little to the east of it. The above image is from a Turkish site which is unfortunately updated only every 3 hours.
Which data should I use?
As the above demonstrates, there can be a wide discrepancy between the different sources, and between any of them and reality. The baloon ascents are of course accurate at the time and location but are likely to be useless where there is scattered convective weather unless one goes to the next level of analysis and interprets the lapse rates.
The SigWx is less reliable than one might expect because it does not forecast vertical cloud extent; the vertical extents of the scalloped areas apply to the icing or turbulence only !! Also, around 2007 the cloud data was "simplified"... previously, if e.g. there was a general MOD ICE and MOD TURB XXX/170 and ISOL EMBD CB XXX/290, both were presented. After the change, the ISOL EMBD CB XXX/290 replaces the stratiform cloud which was previously indicated by the MOD ICE XXX/170, and is all that is shown, so you lose the valuable info that the tops are mostly FL170.
The Meteox radar data is suprisingly good in this kind of difficult weather. On other occassions (e.g. the photograph at the start of this article) radar would show absolutely nothing, but then you don't really care anyway because there is nothing up there of relevance.
A simple sanity check on anything coming out of the GFS model is to check it against the timing of the fronts shown on the UKMO MSLP chart. Forecast tephigrams should show the expected dramatic cloud thickness and other changes at the appropriate time. It seems to me that weather forecasting is a lot more accurate in what happens than when it happens, so fixing the timing better is always worth doing.
The go/no-go flying decision is usually a process of checking off factors which may compromise the safety or comfort of the flight. I have normally been conservative (due to carrying passengers who do not want turbulence) and would normally scrap a flight which would pass through a frontal system, but there is little flight-safety justification for such a simple rule. Perhaps the best process is to review all the sources available and provided that any high cloud (above the aircraft ceiling) is likely to be scattered, the flight should proceed. However it is apparent that the techniques presented in this article are likely to work well for conservative pilots but less well for those who are willing to push the boundaries of icing and turbulence.
My personal rule is to cancel if the forecast tops are above FL160, and with an actual operating ceiling c. FL200 it has so far always worked. Forecast tops well above FL160, in N Europe, tend to indicate significant lifting activity and then all bets are off, not only regarding the actual tops but also regarding forecasting accuracy.
New Sources
This Spanish site shows actual cloud tops but the server is unreliable.
This EUMETSAT site
shows just the right thing but with a useless resolution... they sell usable
data for lots of €€€ ![]()
This most useful IR image is from the UK Met Office is updated every hour and can be found here
Unfortunately this does not have a temperature scale, but with a little bit of experience and correlating the image to areas where known very high tops will be (e.g. fronts) it is pretty obvious whether the tops in a given area will be FL100 or FL300. For example, referring to the above image, the tops to be expected on a flight from Split in Croatia to Shoreham in the UK will be below FL150 and thus flyable "VMC on top" in any reasonable IFR touring aircraft. A post-mortem examination of the Skew-T (weather baloon ascent) data for the route shows the tops to be generally below FL100.
The source for these IR images is EUMETSAT whose general latest-image website is here. The images corresponding to the above UKMO one are probably here and here. However, the UKMO image is usually more up to date...
These IR images represent about the only "cloud tops METAR" available in Europe.
I wrote to the UKMO asking them why they don't offer a temperature scale. This is their reply:
The small satellite images that we put onto the Met Office web pages represent
a compromise between providing the public with an up-to-date picture of the
cloud patterns of the UK and providing higher resolution satellite imagery in
a form suitable for quantitative interpretation. This compromise takes account
of the variable nature of the internet connections available to the public.
Whilst the infrared greyscale pictures you refer to do indeed represent the
temperature of the emitting surface (cloud, land or sea) their contents can
only be interpreted in relative terms (eg one area of cloud being warmer or
colder than another).
Adding a temperature scale to the image is far from straightforward with such
a product since significant ambiguities could be introduced (for example with
thin high cloud) that might lead to misinterpretation with potentially serious
consequences. It is however, possible to apply a scientific approach to estimating
the actual cloud-top temperature from the analysis of multi-spectral image data.
The Met Office operates as a Trading Fund so this is a product we can provide
on a commercial basis.
Hmmm...
The chief drawback of the IR image alone is that it doesn't distinguish between (a) 30,000ft of solid IMC (with all kinds of nasties hiding inside), and (b) a thin cloud layer at 30,000ft with not much underneath it. This can lead to unnecessary flight cancellations.
This is where additional data comes in. A radar image (e.g. Meteox) will show up any heavy cloud. It won't show the vertical extent of it, but it is a safe bet that if you get a strong return on the radar image, plus IR image tops way too high to outclimb, it's a no-go. Similarly if the enroute TAFs/METARs show +TSRA etc and the MSLP chart shows a front in the area. But a large and very uniform-shade area on the IR image, with nothing hazardous showing on the radar or the TAFs/METARs, and with no fronts showing on the MSLP chart, is probably just thin high altitude cloud.
A great site for sferics (lightning discharges) is here. This shows actual thunderstorms in more or less real time, and due to the triangulation / date stamping of the data it is very accurate geographically. This provides valuable supporting information for the satellite IR images.
Update 3/2013
Here is another IR satellite image, also from EUMETSAT, which is a useful backup to the UKMO image discussed above.
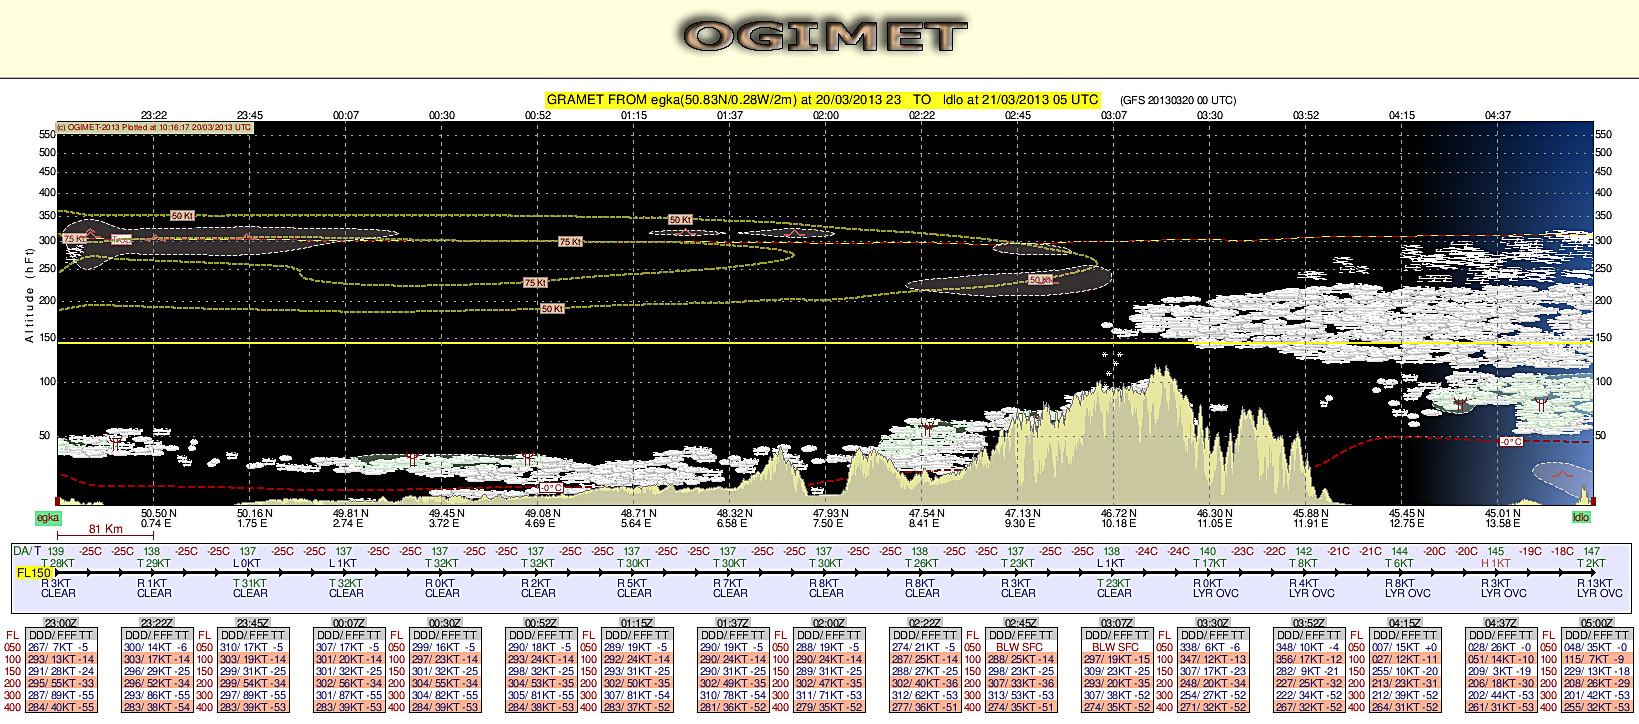
However, an amazing new site for 3D cross-sections has appeared: GRAMET. In essence, you enter the start and end of the route e.g. EGKA_LDLO, the start and end times of the flight, optionally the flight level, and you get this (click for 1:1 pic)
The above corresponds to the time of this MSLP chart (click for 1:1 pic)
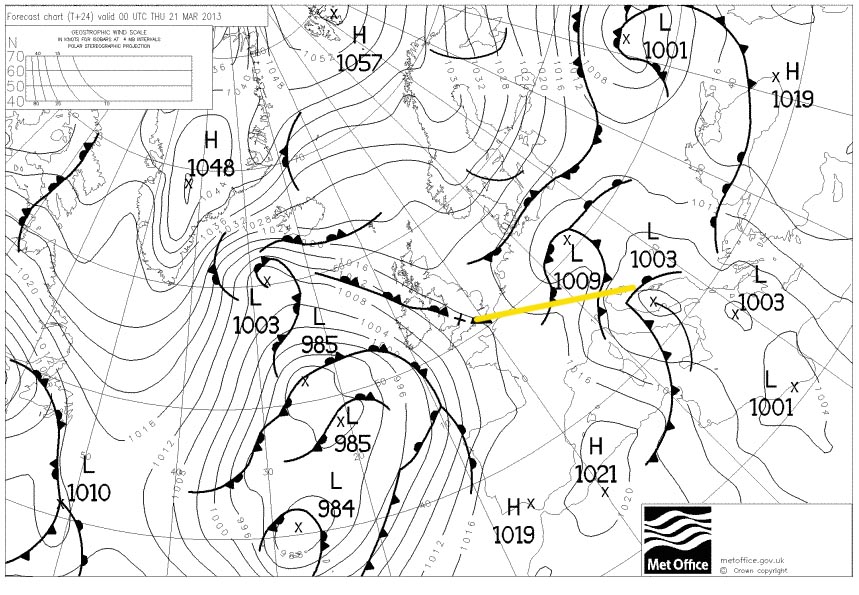
with the straight-line route shown in yellow. It does look about right...
This site, like all the others, uses the U.S. GFS weather model data. If you did select a flight level, you get a yellow line in the GRAMET image and you can see the temperatures at that level, along the route.
This is a superior replacement for the old Meteoblue site which never worked properly (due to a flaky Java implementation) and is probably close to being shut down anyway.
This page last edited 20th March 2013.
Any feedback, reports of dead links, corrections or suggestions much appreciated:
Contact details
